
Date Issued – 9th September 2024
Asia Shares Slip, but US and EU Futures Find a Bid
Asian Markets Struggle Amid Growth Concerns
Asian equity markets opened the week under pressure as concerns surrounding U.S. and Chinese economic growth weighed heavily on investor sentiment. The impact was particularly felt in China, where newly released Consumer Price Index (CPI) data highlighted continued deflationary trends. Producer prices fell by 1.8% year-over-year in August, surpassing expectations of a 1.4% drop, while CPI rose by only 0.6%, primarily due to food price increases. This weak demand environment pushed Chinese blue-chip stocks down by 1%, hitting their lowest point in seven months after a 2.7% decline the previous week. Meanwhile, Japan’s Nikkei index suffered further losses, declining by 0.8% on top of last week’s 6% slump, driven by a sell-off in technology stocks. The MSCI index of Asia-Pacific shares, excluding Japan, dropped 1.2%, following a 2.25% fall last week, and South Korea’s market slipped by 0.2%.
U.S. and European Futures Show Resilience
While Asian markets struggled, U.S. and European stock futures showed signs of recovery. S&P 500 futures rallied by 0.4%, and Nasdaq futures gained 0.6%, rebounding from Friday’s downturn. In Europe, EUROSTOXX 50 futures increased by 0.5%, while FTSE futures strengthened by 0.6%, indicating a more positive start to the week.
Federal Reserve Rate Cut Speculation
Investor sentiment remains cautious ahead of the Federal Reserve’s next policy meeting. Mixed data from the U.S. August payroll report has sparked debate over the potential for a significant rate cut. Fed fund futures currently indicate a 30% chance of a 50 basis point cut, influenced by recent comments from Fed Governor Christopher Waller and New York Fed President John Williams. However, as Barclays economist Christian Keller remarked, “While the labor market is cooling, there’s no indication of the rapid decline necessary to justify a 50 basis point rate cut. We anticipate the Fed will start with a 25 basis point reduction, followed by two more such cuts later this year.” Despite this caution, markets are pricing in 113 basis points of rate cuts by the end of 2024, with an additional 132 basis points forecast for 2025. Wednesday’s release of U.S. CPI data for August is expected to further support the case for a cut, with headline inflation projected to ease to 2.6% from 2.9%.
ECB Poised for Policy Easing
Across the Atlantic, attention is focused on the European Central Bank (ECB), which is widely expected to implement a quarter-point rate cut during its policy meeting on Thursday. However, uncertainty remains about whether further cuts will follow in October and December. Analysts at TD Securities highlighted the conflicting pressures facing the ECB: “Strong wage growth and service-sector inflation are strengthening the case for hawkish action, while slowing growth data supports the doves. A series of gradual cuts appears more in line with the ECB’s current economic projections.”
Bond Yields and Currency Movements
Global bond markets rallied on the prospect of monetary policy easing, with U.S. Treasury yields hitting their lowest levels in 15 months. However, profit-taking on Monday led to a slight uptick, with two-year yields rising to 3.704% and 10-year yields reaching 3.748%. On the currency front, the U.S. dollar strengthened by 0.6% against the yen, while the euro remained stable at $1.1076, retreating from Friday’s peak of $1.1155.
Oil Prices Find Support
In commodity markets, oil prices saw a rebound as a potential hurricane system approached the U.S. Gulf Coast. Brent crude increased by $0.88 to $71.93 per barrel, while U.S. crude climbed by $0.91 to trade at $68.58 per barrel. This comes after oil prices suffered their largest weekly decline in 11 months amid ongoing concerns about global demand.
Natural Gas and Oil Forecast: WTI Eyes $70 Resistance as Demand Concerns Linger
Market Overview
WTI crude oil futures have rebounded to $68.7 per barrel after last week’s sharp 8% drop, driven by concerns over weakening labor data in the U.S. and Europe, signaling potential energy demand slowdown. Additionally, softer Chinese consumption and the possibility of an agreement to resume oil production in Libya have added further pressure. Bank of America has revised its 2025 oil forecast, lowering Brent crude to $75 per barrel and the U.S. benchmark WTI to $71. These macroeconomic and geopolitical concerns are also affecting natural gas markets, where uncertainty around global demand is creating volatility for both commodities.
Natural Gas Price Forecast
Natural Gas (NG) is currently trading at $2.196, down by 2.52%. The price sits just below the critical pivot point of $2.19, which is acting as a strong support level. An upward trendline indicates continued buying pressure as long as NG remains above this mark. Immediate resistance levels lie at $2.23, followed by $2.29 and $2.35. If NG falls below $2.19, a sharper decline towards $2.16 and $2.12 could occur. The 50-day EMA at $2.21 and the 200-day EMA at $2.15 offer mixed signals, but if NG holds above $2.19, it could support a bullish outlook in the short term. Keep a close watch on these levels for potential moves.
WTI Oil Price Forecast
WTI crude oil (USOIL) is trading at $68.54, slightly below the key pivot point of $68.72. A break above this critical level could signal a shift towards a bullish outlook, with immediate resistance at $70.73, and further hurdles at $72.00 and $74.06. However, the 50-day EMA of $69.95 and the 200-day EMA of $73.03 indicate that downside pressure remains strong. On the support side, $67.23 is the first key level to watch, followed by $65.81 and $64.10. For now, oil remains in a wait-and-see mode, with a bearish bias below $68.72. Should prices break above this level, a renewed bullish momentum could emerge.
Brent Oil Price Forecast
Brent crude (UKOIL) is currently trading at $71.89, just under the crucial pivot point of $72.16. A downward channel on the 2-hour chart is reinforcing resistance near this level, keeping the price under pressure. If Brent breaks above $72.16, we could see a bullish push towards $73.48 and potentially $74.80. However, if it stays below the pivot, a bearish correction is likely, with immediate support at $70.94, and downside potential extending to $69.97 and $68.93. The 50-day EMA at $73.48 and the 200-day EMA at $76.66 suggest stronger resistance ahead, signaling a cautious, bearish stance unless Brent breaks above $72.16.
Conclusion
Both oil and natural gas markets remain in a delicate balance. WTI and Brent are facing key resistance levels that could trigger either a bullish breakout or continued bearish pressure, depending on whether prices can sustain above critical pivots. Natural gas, too, is at a crucial support level, with upward momentum contingent on maintaining key thresholds. In the near term, the markets are poised for potential movement in either direction, largely influenced by demand concerns and geopolitical developments.
Tech Bull Trend in Question Amid September Selloff: BTIG
QQQ Index at Critical Juncture
The tech-heavy QQQ index, which tracks the Nasdaq 100, is approaching a pivotal point, with the 200-day moving average (DMA) acting as a key support level. BTIG suggests that if the index can test and reclaim this level, it may signal a tactical low for the sector, providing a short-term boost. However, the analysts caution that any rebound could be short-lived if broader structural issues in the tech sector’s relative strength persist. “Beyond absolute prices, technology’s relative trend is in question, as it has broken below both its August lows and spring highs,” the analysts said. This decline reflects the sector’s underperformance compared to other segments of the market, especially as leading tech companies have struggled to maintain earlier momentum.
Divergence Among Major Tech Companies
Microsoft (NASDAQ) has shown relative weakness, testing its 200 DMA, highlighting broader concerns about the sector. In contrast, Meta (NASDAQ) has exhibited more resilience, maintaining strength near key resistance levels. This divergence indicates that the technology sector is becoming more bifurcated, with some companies holding up better than others.
Rise in Volatility and Market Sentiment Shift
BTIG analysts have also noted a shift in market sentiment, marked by the re-inversion of the VIX curve, a key volatility and fear gauge. Although the VIX is not yet at levels typically associated with a durable market bottom, the increase in volatility signals that fear is creeping back into the market. This could potentially lead to another tradable low, but BTIG stresses that the overall market environment remains fragile. While large-cap tech companies, often referred to as the “Mag 7,” have managed to hold key support levels relative to the broader S&P 500, the group is more divided than in previous periods. As structural concerns about the sector’s long-term strength linger, the technology sector’s leadership role in the market is increasingly in question.
Apple Stock Price Levels to Watch Ahead of iPhone 16 Launch Event
Apple Inc. (AAPL) shares are set to be in the spotlight on Monday as the tech giant unveils its new AI-powered iPhone during its “Glowtime” product launch event. In addition to the highly anticipated iPhone 16, Apple is expected to introduce other devices and offer updates on its software, including the AI-driven iOS 18.1. Apple’s stock has seen a significant rally, climbing around 13% since bottoming out in early August. This has sparked speculation of a potential “sell-the-news” event, as Morgan Stanley has noted that Apple shares often underperform the S&P 500 on the day of an iPhone launch, but generally outperform the broader market over the following three months. Here’s a closer look at the key technical price levels for Apple stock leading into this crucial event.
Recent Price Movements and Technical Setup
After hitting a new record high in mid-July, Apple’s stock retraced by as much as 17%, dipping to the early June breakout area before staging a strong recovery throughout August. Despite this bounce, the stock closed below its 50-day moving average (MA) last Friday, dipping by 0.7% to $220.82, amid general weakness in the tech sector. Volumes have been lackluster, which may indicate that the recent pullback lacks strong selling conviction. Going forward, investors should monitor the following support and resistance levels as Apple enters its most significant product showcase of the year.
Key Support Levels
- $218 Support Zone: This level is backed by a trendline that connects several trading sessions around the June peak and July trough. If selling pressure builds following the launch, this area will be the first line of defense.
- $207 Critical Support: If the $218 level fails to hold, the next significant support is around $207. This area marks the June 11 breakout candlestick close, aligning with the June low, making it a potential spot for buy-limit orders.
- $196 Long-Term Support: A more severe downside move could bring Apple’s stock down to $196, a level near last month’s low and close to the 200-day MA. This region, where previous resistance could now act as support, may attract bargain hunters.
Resistance Levels to Monitor
- $233 Resistance Zone: On the upside, if Apple shares gain momentum ahead of the iPhone launch, the stock may face resistance around $233. This level sits just below Apple’s all-time high (ATH) and could serve as a key area where profit-taking occurs.
Conclusion
With the launch of the iPhone 16 and Apple’s product lineup in focus, investors will be closely watching how the stock behaves in the coming days. While the stock could face volatility tied to the “sell-the-news” phenomenon, key support levels at $218, $207, and $196 could provide buying opportunities. Conversely, resistance around $233 will be a crucial area to monitor if the stock rallies. With broader market trends and historical patterns in play, Apple’s stock is positioned for potential large price swings following the event.
DOJ Begins Probe Into Nvidia Contracts Amid AI Market Dominance Concerns
The U.S. Department of Justice (DOJ) has initiated an inquiry into Nvidia, scrutinizing the company’s dominant position in the artificial intelligence (AI) chip market. As reported by the Wall Street Journal on Sunday (Sept. 8), the investigation seeks to determine whether Nvidia, which controls more than 80% of the AI chip sector, is leveraging its contracts and partnerships to maintain an unfair advantage in the marketplace. The probe remains in its early stages, with no subpoenas issued to Nvidia thus far, though sources suggest a deeper investigation could follow.
Nvidia’s Response to the Investigation
Nvidia has responded by emphasizing that its success is built on innovation and market merit. A company spokesperson stated, “NVIDIA wins on merit, as reflected in our benchmark results and value to customers, who can choose whatever solution is best for them. We compete based on decades of investment and innovation, scrupulously adhering to all laws.” This regulatory attention comes on the heels of a broader Federal Trade Commission (FTC) investigation into AI investments by other tech giants, including Amazon, Google, and Microsoft, initiated earlier this year.
Shift in Antitrust Enforcement
The DOJ’s inquiry into Nvidia is part of a broader trend of intensified antitrust scrutiny under the Biden administration, which aims to rein in the power of tech companies. Historically, regulators have been reluctant to challenge the dominance of Big Tech, a stance that has shifted as critics from across the political spectrum have called for stricter oversight. Randal Picker, a law professor at the University of Chicago, commented, “The question is always, how do you exercise [market power]?”
The Growing Role of AI in Business
Amid these regulatory developments, AI’s role in business and commerce continues to expand. In a separate interview with PYMNTS, Shoab Khan, Chancellor of the Sir Syed CASE Institute of Technology, discussed both the limitations and potential of AI in commerce, particularly following the $1 billion funding round for AI startup Safe Superintelligence. Khan noted that while AI can be challenging in unpredictable markets, such as cryptocurrency, it holds immense promise for decision-making in commerce when properly modeled. The DOJ’s investigation into Nvidia signals a new chapter in the regulation of AI, potentially reshaping the competitive landscape in this fast-growing sector.
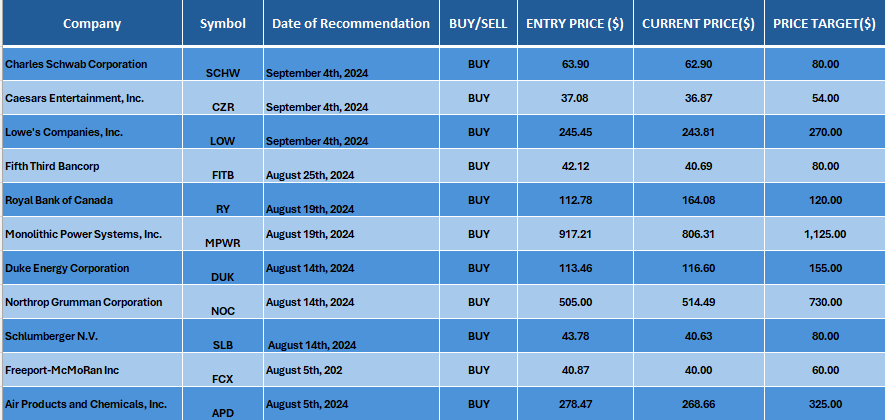
Find below some of our Buy/Sell Recommendations. Balfour Capital Group is a distinguished global boutique investment management firm with $400 million AUM and over 1000 Clients.
Disclaimer: This post provides financial insights for informational purposes only. It does not constitute financial advice or recommendations for investment decisions.